Data fact extraction
FOX represents each fact as a six-element tuple of subspace, breakdown, measure, type, score, and focus. It systematically enumerates eligible subspaces and extracts eight supported fact types with impact-based pruning.
Nanyang Technological University
Accepted at IEEE VIS 2026 · To appear in IEEE Transactions on Visualization and Computer Graphics (TVCG)
Exploratory Data Analysis (EDA) systems extract and present data facts to summarize meaningful patterns such as trends and correlations for efficient dataset exploration. However, existing approaches rarely consider outlier detection at the level of data facts, and heterogeneous facts from different analytical scopes are often aggregated in a single view, making it difficult to define meaningful metrics and effectively analyze data fact outliers. To fill this gap, we present FOX, a novel visual analytics system for interactive data Fact Outlier eXploration. FOX organizes data facts into groups with consistent analytical scopes and computes a unified outlier score that combines distribution-based and pattern-based components. Its interface comprises an Upload Panel for data preparation and two coordinated exploration panels: the Overview Panel employs a matrix-based visualization to enable an intuitive overview of all data facts, and the Main Panel provides four linked views for cluster-level and fact-level analysis. We evaluated the usability and effectiveness of the system through two usage scenarios on public datasets and in-depth interviews with 12 participants. The results show that FOX enables meaningful detection, analysis, and explanation of data fact outliers.
Five-minute overview of data preparation, outlier-group discovery, cluster analysis, and fact inspection.
FOX represents each fact as a six-element tuple of subspace, breakdown, measure, type, score, and focus. It systematically enumerates eligible subspaces and extracts eight supported fact types with impact-based pruning.
Facts are partitioned by identical breakdown and measure attributes. Each group therefore defines a consistent analytical scope in which comparisons remain meaningful and explainable.
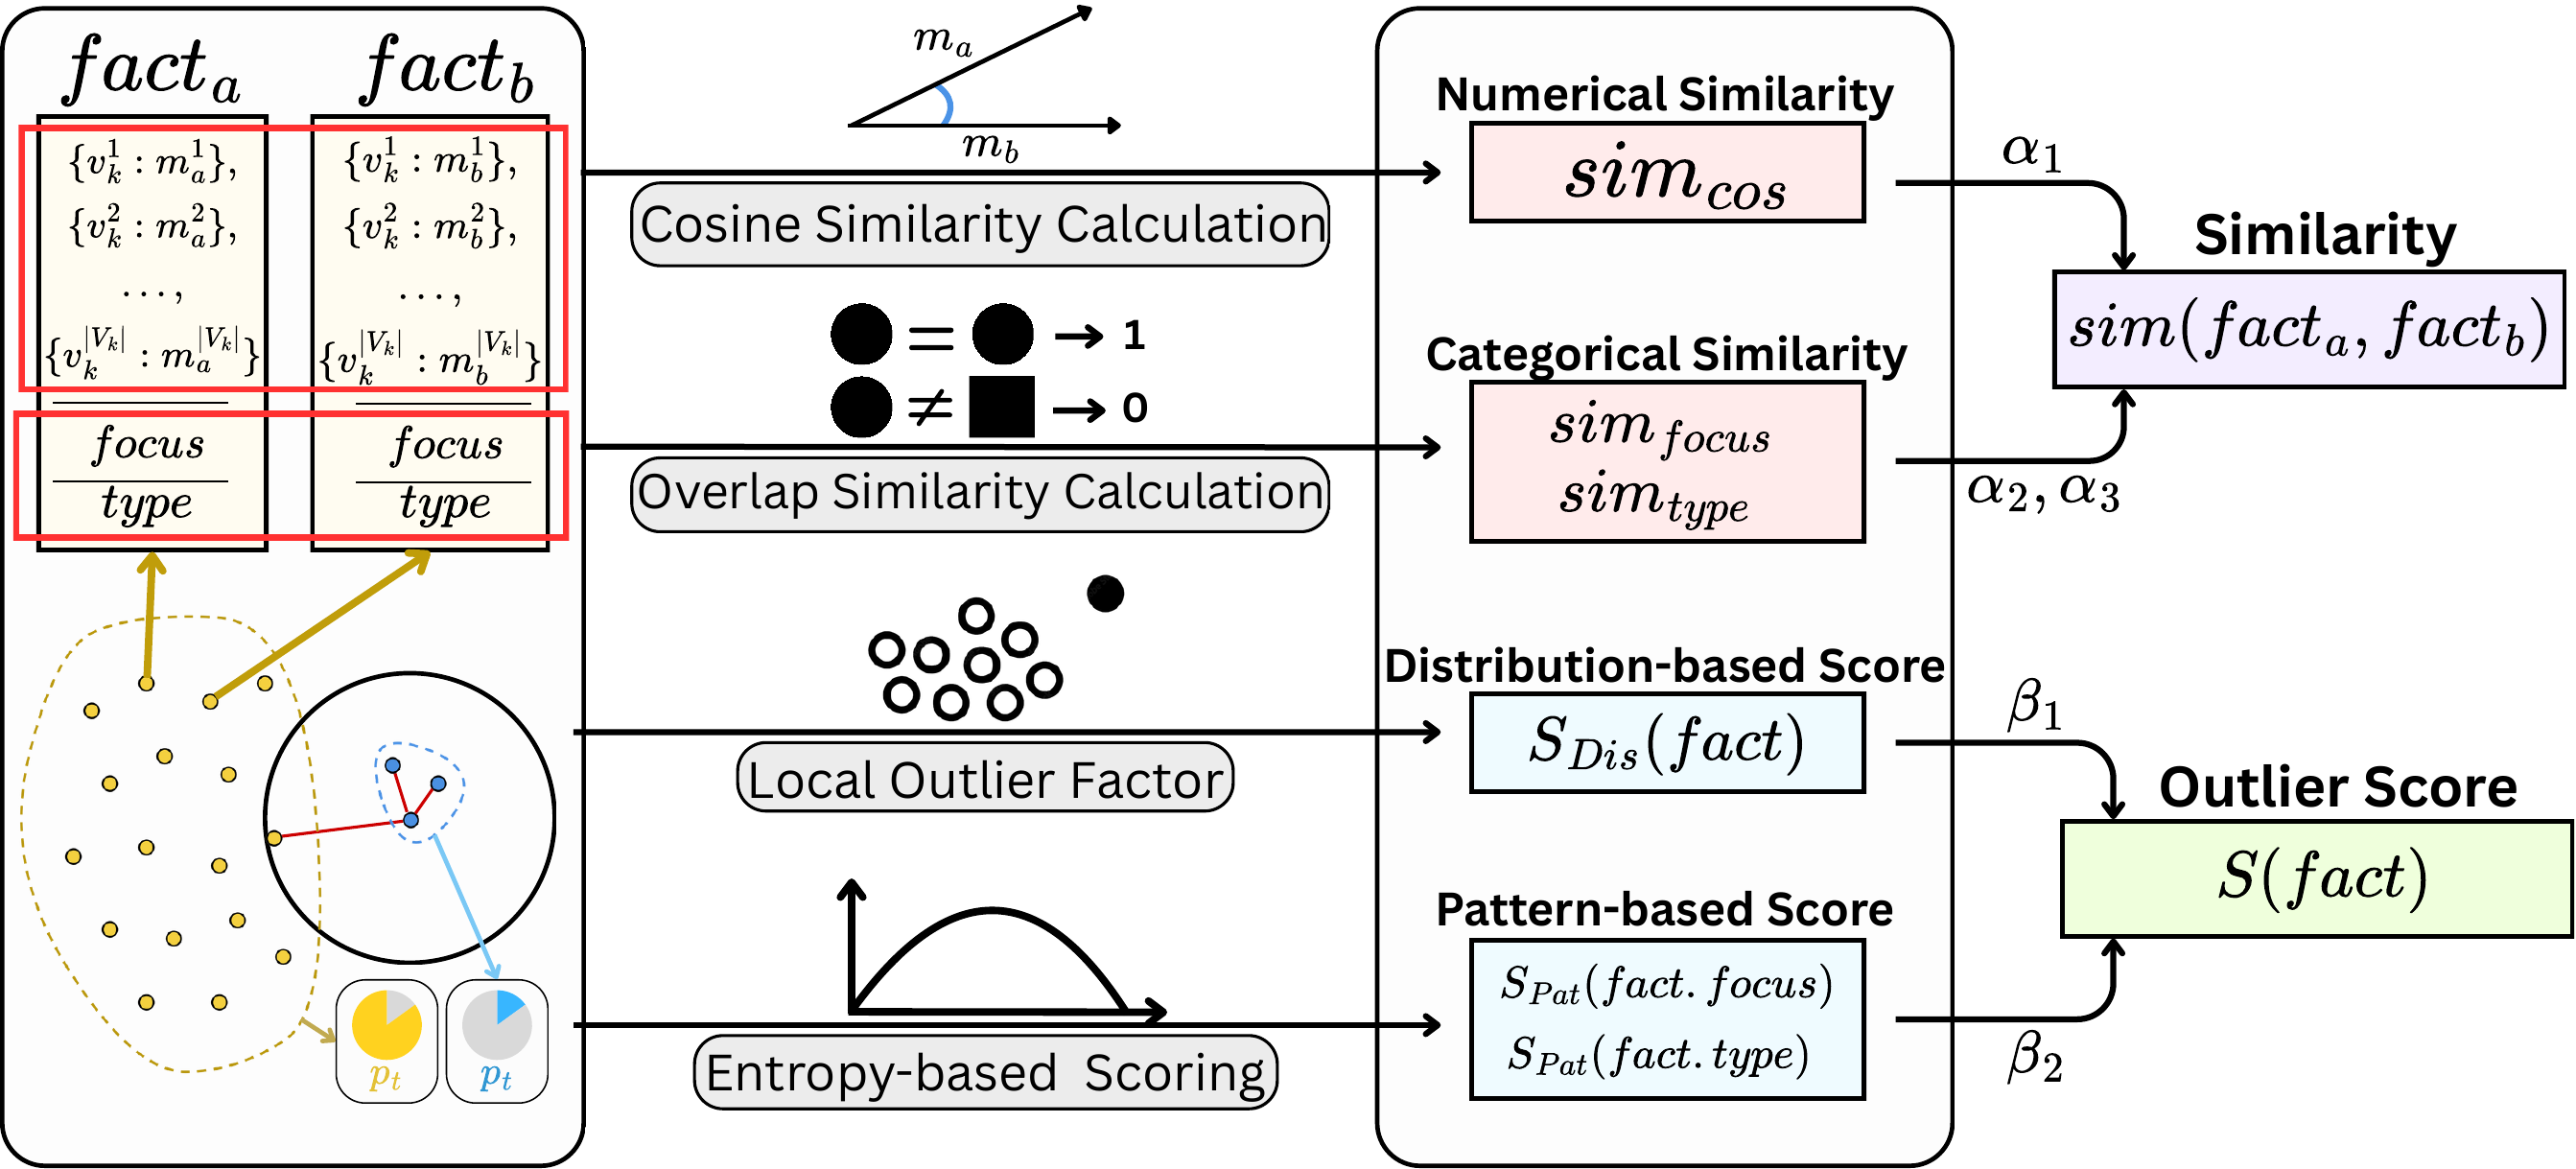
A weighted similarity combines cosine similarity over aggregated value distributions with categorical overlap on fact type and focus, capturing both numerical and semantic characteristics.
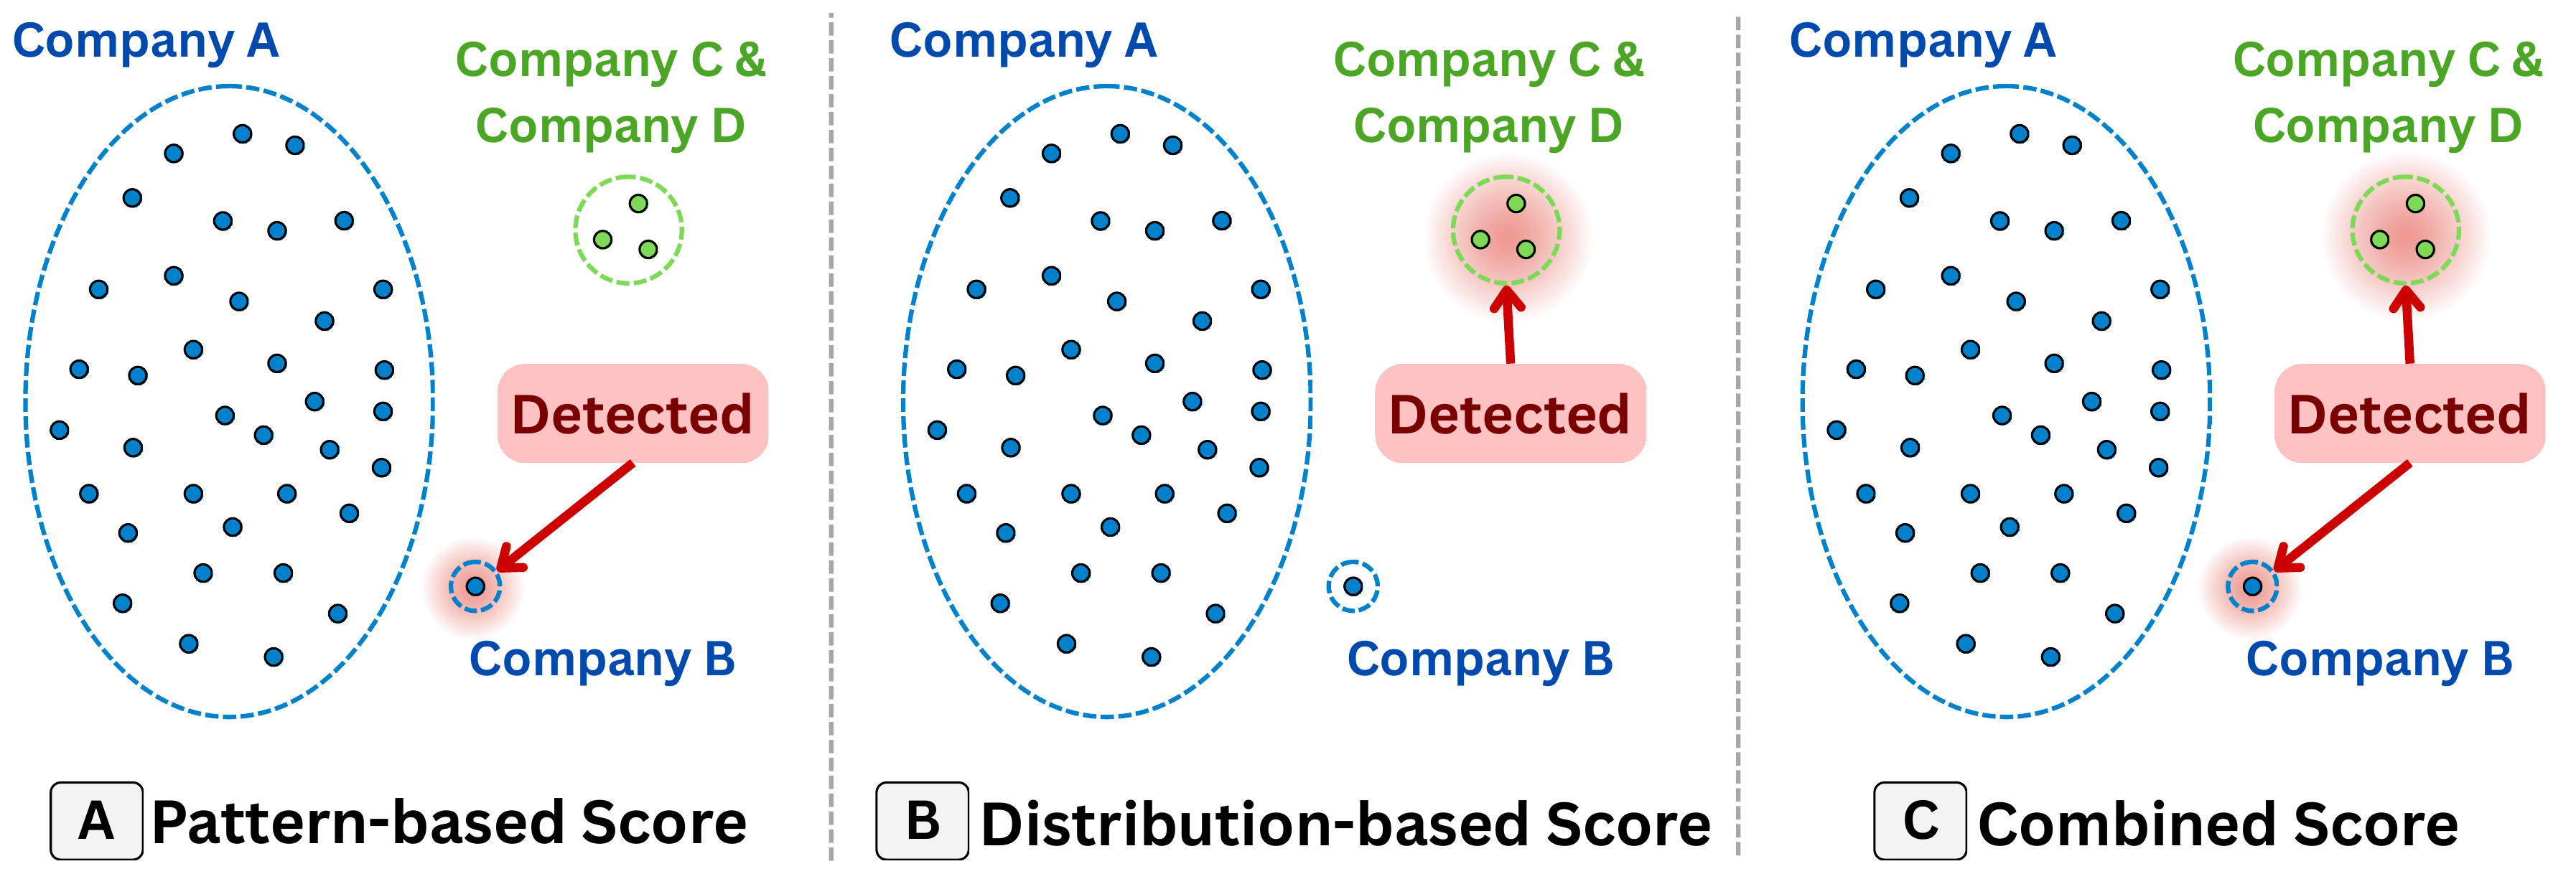
A normalized LOF score captures distributional neighborhood deviation, while an entropy-based score captures rare fact types and focuses. Their weighted combination yields the final score.
Scenario 1
Among 14 fact groups, seven contain outliers. FOX reveals a negative discount-sales relationship for technology products shipped by second-class delivery, joint sales dominance by two supermarkets for consumer furniture, and two unusual decreasing quantity trends.
Kaggle dataset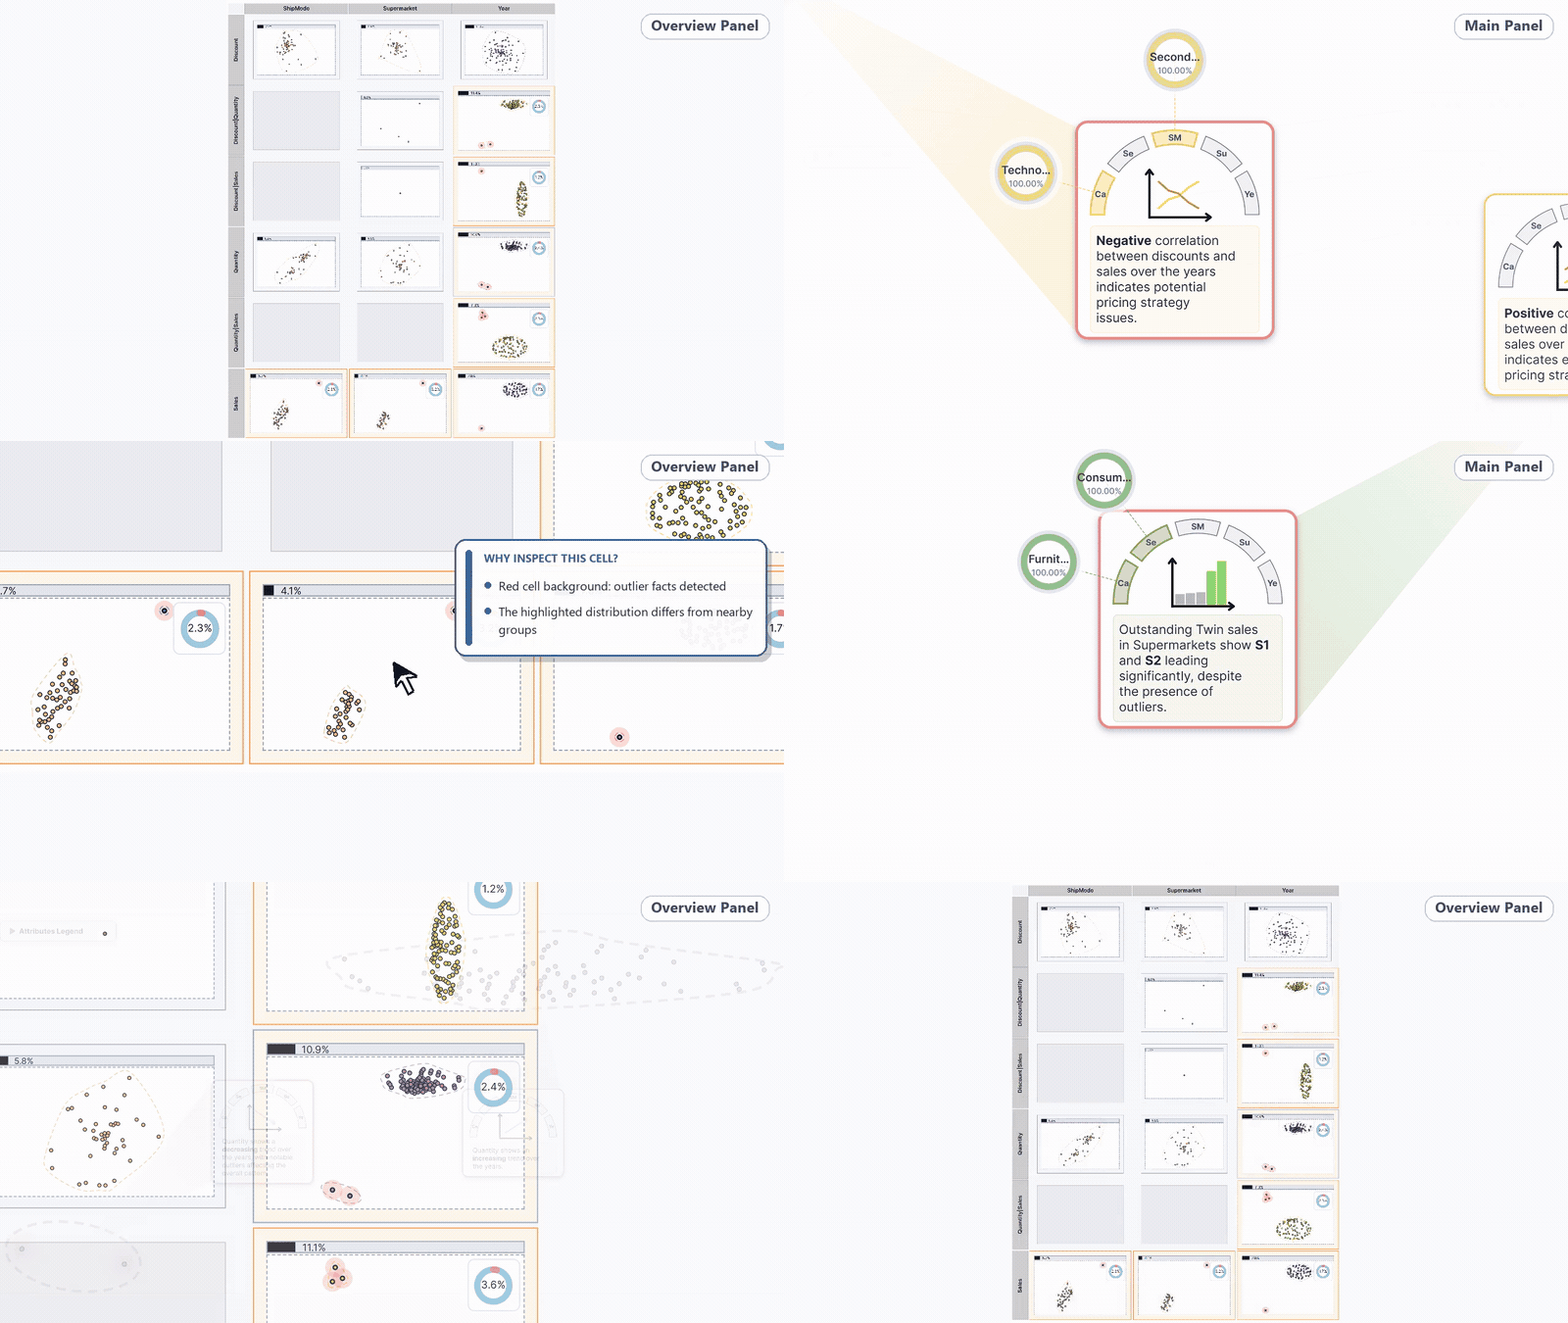
Scenario 2
Among 18 fact groups, three contain outliers. FOX identifies distinct front- and four-wheel-drive distance patterns, together with a rare utility-vehicle sales-dominance fact under diesel and manual-transmission conditions, with an outlier score of 0.67.
Kaggle dataset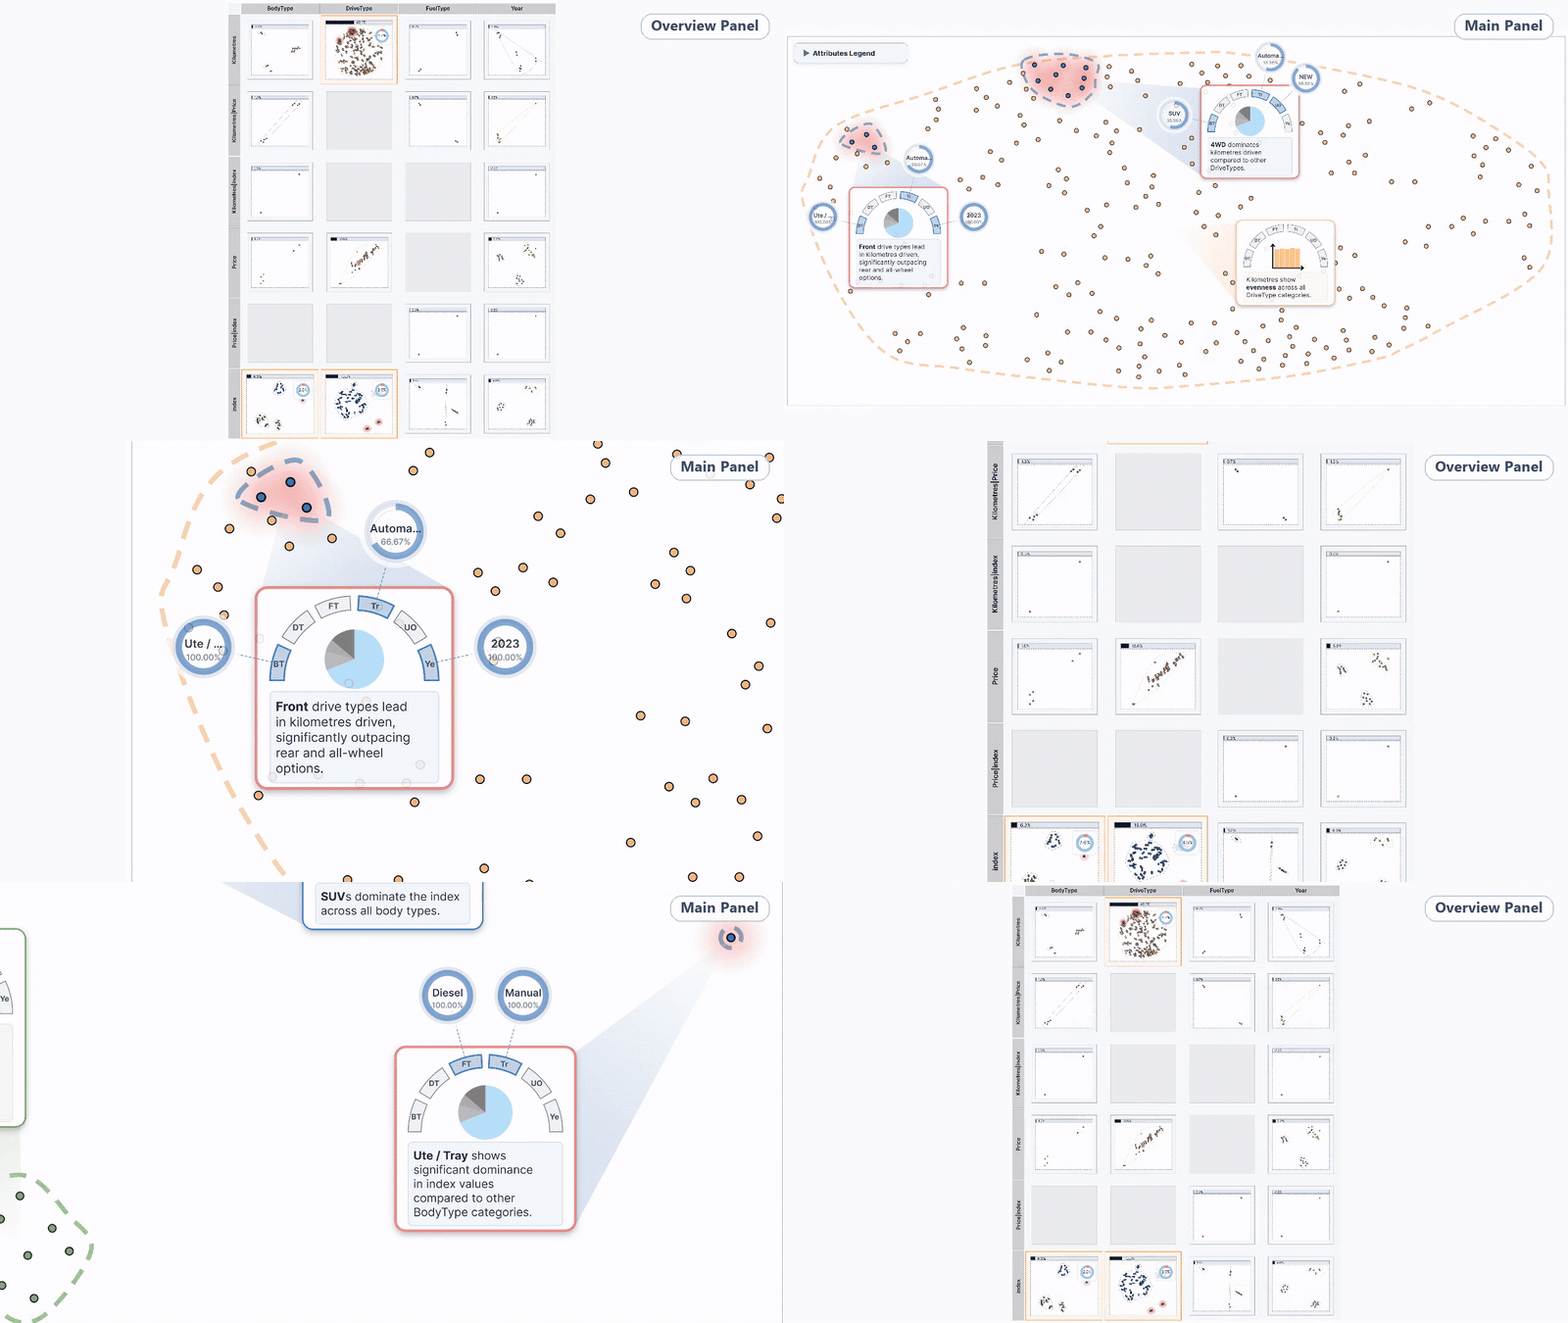
Li, Y., & Wang, Y. (2026). FOX: Visual Exploration of Data Fact Outliers. arXiv:2608.08671 [cs.HC].
DOI: 10.48550/arXiv.2608.08671. Final TVCG volume, issue, and page numbers are forthcoming.